Anomaly Detection and Contribution Analysis
29 Apr 2018 » Analytics Tips
In my previous post, I introduced Adobe Sensei. Two of the examples I gave, of tools using this feature, were anomaly detection and contribution analysis. Last week one of my customers asked me about these features so I thought I would explain them in more detail in this blog.
Setting up the report
This is your starting point. In a recent release of Adobe Analytics, these two features were removed from Reports & Analytics. Now, you can only find them in Analysis Workspaces, which means you need to first create a report. However, you should already be using this tool to run your analysis and reports.
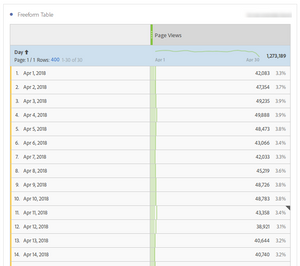
Remember that anomaly detection only works with trended report. If you are not familiar with this concept, it is just a report where you see the evolution of a metric over time. To keep things simple I am using total page views, but you could/should use other, more important metrics:
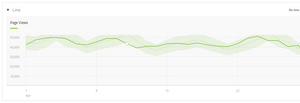
Then, I create a line visualisation from this freeform table:
Anomaly detection
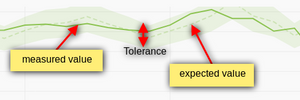
Actually, you do not need to do anything at all. Adobe Analytics generates this information automatically. It not only shows the measured values, but also computes what are the expected value and the tolerance (or confidence) around this expected value, based on the historic sequence.
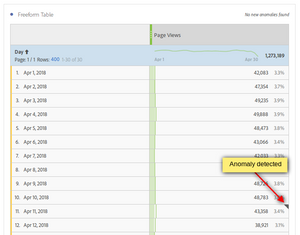
In the freeform table, you will have noticed that for each day, in the “Page Views” column there is a green bar and a grey line. The green bar is the measured value and its length is the relative value against the total, the percentage you see on the right. The grey line is the expected value.
In the line report, you see even more information, as the tolerance is also drawn around the expected value, which is a dashed green line. The solid green line is the measured value.
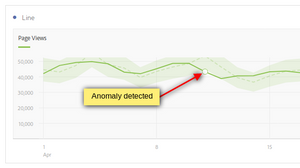
The interesting part is when Adobe Analytics detects a value that falls above or below the tolerance. This is the anomaly itself. You can see it highlighted both in the line visualisation and in the freeform table. Again, as I said before, you do not need to do anything, it is highlighted out of the box.
Disabling anomaly detection
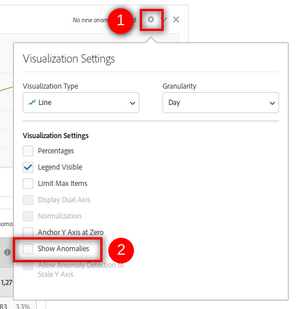
What if you do not want to see the anomaly in the reports? This feature is enabled by default, but you can easily disable it. Just hover over the visualisation, click on the dented wheel and deselect “Show Anomalies”:
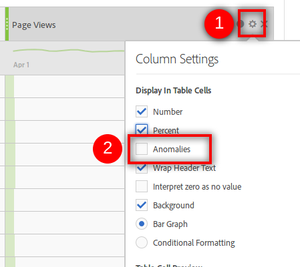
In the case of the freeform table, the process is very similar. Hover over the metric where you want to disable this feature, click on the dented wheel and deselect “Anomalies”:
Alerts
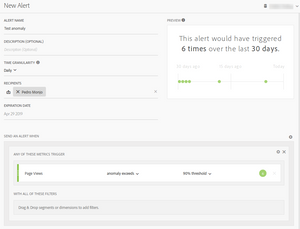
You can also create alerts based on anomaly detection. Instead of having to pull the report daily and manually check for any anomalies, you can ask Adobe Analytics to run this report for you periodically and send you an email when it detects an anomaly. This feature is under the Workspace menu “Components > New Alert”. You need to set or configure the following settings:
- Report suite name
- A name for the alert
- An optional description
- Time granularity or frequency of the analysis, from hourly to monthly; obviously, this is the maximum frequency you will receive emails
- List of recipients to be notified, which can be any existing Adobe Analytics user or an email address
- Expiration date, after which, no more alerts will be sent
- Metrics you want to analyse, with the threshold to trigger the alert
- Dimension to filter the data (similar to segments)
Before saving, it will show you a preview of the number of times this alert would have triggered in the last 30 days.
Contribution Analysis
The final and, possible, most important part of the anomaly detection feature is to find out why this anomaly happened in the first place. This is where another Sensei feature comes into the picture: contribution analysis. The Adobe definition is:
Contribution Analysis is an intensive machine learning process designed to uncover contributors to an observed anomaly in Adobe Analytics. The intent is to assist the user in finding areas of focus or opportunities for additional analysis much more quickly than would otherwise be possible.
One word of caution. This process finds correlations, not causations. With the information of these correlations, you should be in a better position to find the cause of the anomaly, which is still a manual process.
Since this analysis is very CPU intensive, Adobe limits the number of times you can run it per month. I recommend that, before proceeding, you review the Contribution Analysis Tokens overview.
Run the process
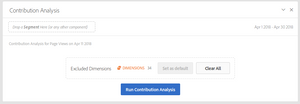
To start the process of contribution analysis, hover over the anomaly, either in the line visualisation (circle) or the freeform table (triangle in the upper-right corner), and click on “Analyze”. This will add a new panel to your workspace. Before you run the process, you have the option to exclude dimensions that you think will show up in the report (because you already know there is a correlation), but you know have not relation with the anomaly. Once you are ready, click on “Run Contribution Analysis”. It will take some time before the analysis is finished so grab a cup of tea.
Analyse the result
Once the process has finished, it will create a dashboard with the following information:
- The value of the metric when the anomaly was detected.
- A line visualisation with the metric trend.
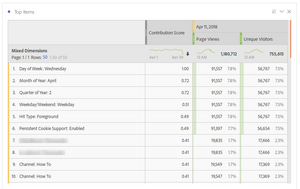
- The top 50 items that contribute to the anomaly.
- 50 segments based on the previous top items.
The report with the top items is where you will most likely want to start your analysis. Some of the dimensions will make no sense, but remember this is machine generated, so it knows nothing about your real website. The contribution score is the main output of the algorithm, a metric that tells you how correlated the analysed and the contributing dimensions are. You can apply any breakdowns you want to the data, to slice and dice it however you want. It is beyond the scope of this post to go into the details of how to perform any deeper analysis from this report. This will largely depend on your particular implementation.
Video of these features
If you want to see a demo of these features combined, I recommend the following video, from the Adobe product team:
