Articles by category: Analytics Tips
Adobe Analytics vs Customer Journey Analytics
When I wrote my post comparing Adobe Journey Optimizer, Adobe Campaign, and Marketo, I got a lot of attention. I guess there is a lot of interest in comparing Adobe tools to decide which one is best for a particular situation. Today I am going to do a similar comparison, this time between Adobe Analytics (AA) and Customer Journey Analytics (CJA).
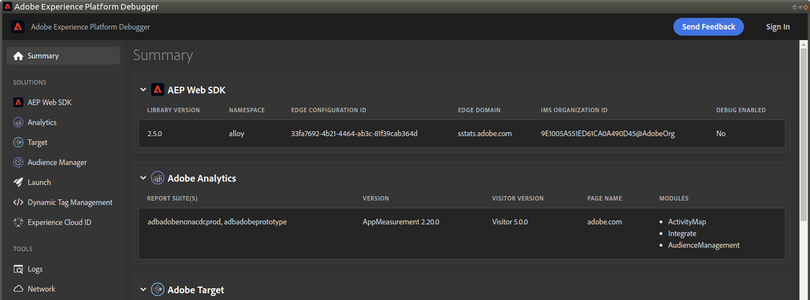
The Adobe Experience Platform Debugger
Every time I check the Adobe Analytics reports of this blog, the most visited post is How to debug an Adobe Analytics implementation. That post was written back in 2016 and, in technology, 5 years is an eternity. More importantly, one of my recommendations does not exist anymore. It is time to update that post and to talk about the successor of the Adobe Debugger: the Adobe Experience Platform (AEP) Debugger.
Reporting vs Analysis
When people talk or think about Adobe Analytics, the first idea that comes to their minds tends to be “reporting”. In fact, this idea applies to any visualisation tool. However, this is only half of the story. Many forget that these tools actually have another, very important, capability: data analysis.
Server-side Download Tracking
You all know that Adobe Analytics has an out-of-the-box solution to track download links. It just works and few people even care about it. You may not know that you can even extend its functionality, by adding additional eVars/props/events to the server call. Not very common, but I had to do it for one client. However, what happens when someone downloads content through a direct link or you have a server-side implementation?
Event serialisation
As I explained in my post on metrics and and dimensions in Adobe Analytics, events (or custom events) are the way to track metrics. In general, you want a metric to increase or decrease depending on the user’s behaviour. However, you may only want it to happen under certain circumstances. More importantly, you do not want to write complex code to manage that.
Metrics and dimensions in Adobe Analytics
In my previous post I explained what dimensions and metrics are in general, with a hint of how web analytics have interpreted them. In today’s post, I will address the next step: how Adobe Analytics has implemented these concepts.
Fundamentals of Dimensions and Metrics
When I started working with Adobe Analytics almost 10 years ago, before I joined Adobe, nobody explained me some web analytics basics. People mentioned concepts like dimensions and metrics and, initially, I did not understand them. In this post I will explain how I visualise these concepts, which helped me understand them. It may help you if you are in a similar situation or you see others having trouble grasping them.
Override Last-Touch Channel
My initial goal, when I wrote about attribution, was actually to talk about the configuration option named “Override Last-Touch Channel” in the Marketing Channels reports. However, I realised I needed an introduction to make it clearer and I wrote my previous post. Now I can go into the details of this technical feature and its consequences.
Some Thoughts on Attribution
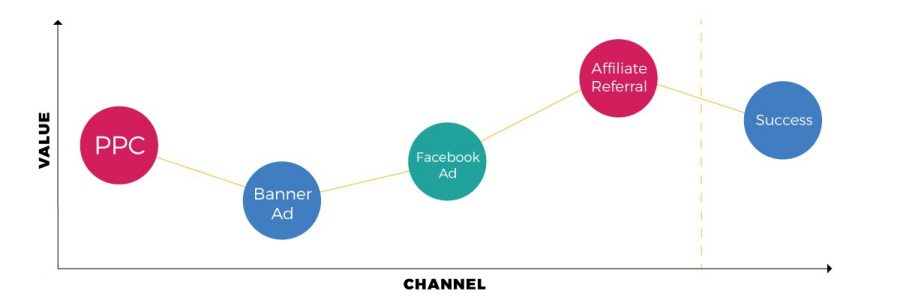
During the EMEA Summit 2019, one Adobe customer asked me about one detail of the Marketing Channels configuration. The conversation we then had around this question, reminded me of the confusions some managers tend to have about attribution. Let me clarify a few things about this topic.
Hybrid Analytics
The last tool I showed in my Summit lab was Adobe Analytics. Initially, I was not sure whether I should write about it. However, I have come up with some ideas to share and here you have the final post on this lab.
Of Visits and Sessions
As I have said a few times, it is very easy to measure page views. I have also explained how to measure visitors. There is, though, another typical question to answer: how many times has a visitor visited our website? Seems like a simple question, right? Well, it turns out, measuring visits is not that simple.
The User-Agent (Part II)
This is the second part of the User-Agent mini series. I split the topic into 2 posts, as it was getting too long. If you have not read the first part, I recommend you start with it. I will now explain how Adobe uses the User-Agent HTTP parameter in the different tools.
Adobe Analytics Data Warehouse
I tend to write about new features of Adobe tools or “cool” ways of using it. That does not mean that I have forgotten about good old features and this is what I am going to do today, explain one of the basic tools of Adobe Analytics: Data Warehouse.
Multi-tenancy in Adobe Analytics
A few weeks ago I introduced the concept of multi-tenancy in the Adobe Experience Cloud. Adobe Analytics has had support for multi-tenancy for a very long time. Recently, all user administration for Adobe Analytics has been moved to the Admin Console, where you now configure everything. Read on if you want to know how to configure multi-tenancy in Adobe Analytics with this new setup.
Real-Time Reports
Today I am going to explain one of those features you rarely use, but it can be very useful in certain circumstances: real-time reports in Adobe Analytics. As its name implies, with this feature you can get certain reports in real-time.
Adobe Analytics Attribution IQ
Until last Thursday, I had an idea of what would this week’s post was going to be about. However, on Friday, it all changed. I saw the internal presentation of Attribution IQ and I changed my mind. I know there are a few series I have not finished, but I think this is more important. But do not worry, I will resume my other series soon. Let’s dive into Attribution IQ!
Server-side Adobe Analytics
Today I will explain how to implement server-side Adobe Analytics. If you have been reading my last few posts, this is a continuation of the series on server-side digital marketing. I assume you are familiar with Adobe Analytics implementations using JavaScript.
Anomaly Detection and Contribution Analysis
In my previous post, I introduced Adobe Sensei. Two of the examples I gave, of tools using this feature, were anomaly detection and contribution analysis. Last week one of my customers asked me about these features so I thought I would explain them in more detail in this blog.
Message Bus
Unless you have been living in a cave, you should already have a data layer in your websites. OK, maybe that is too harsh; however, at least, you should have a plan to put one in place. Once you have a good data layer, the next step I recommend is that you deploy a message bus.
Basic Analytics Metrics
When I started consulting for Adobe Analytics, I remember I had to explain a few times what the basic analytics metrics are. Once you get used to them, you do not realise it can be difficult to first understand them. So, if you are starting with your web analytics career and are still wondering what exactly a visitor, a hit or a visit is, this blog post is for you.


